Import usage dashboard
You'll import the account-console usage dashboard into a workspace and know how to read the Usage page in ~10 min.
What you'll build
A pre-built, editable dashboard in AI/BI Dashboards, scoped to your account or one workspace. Charts break down spend by product, SKU, and tags without authoring SQL first.
Only account admins can import the dashboard from the account console.
Steps
1. Sign in to the account console
Open the account console for your cloud:
- AWS: accounts.cloud.databricks.com
- Azure: accounts.azuredatabricks.net
- GCP: accounts.gcp.databricks.com
2. Import the usage dashboard into a Workspace
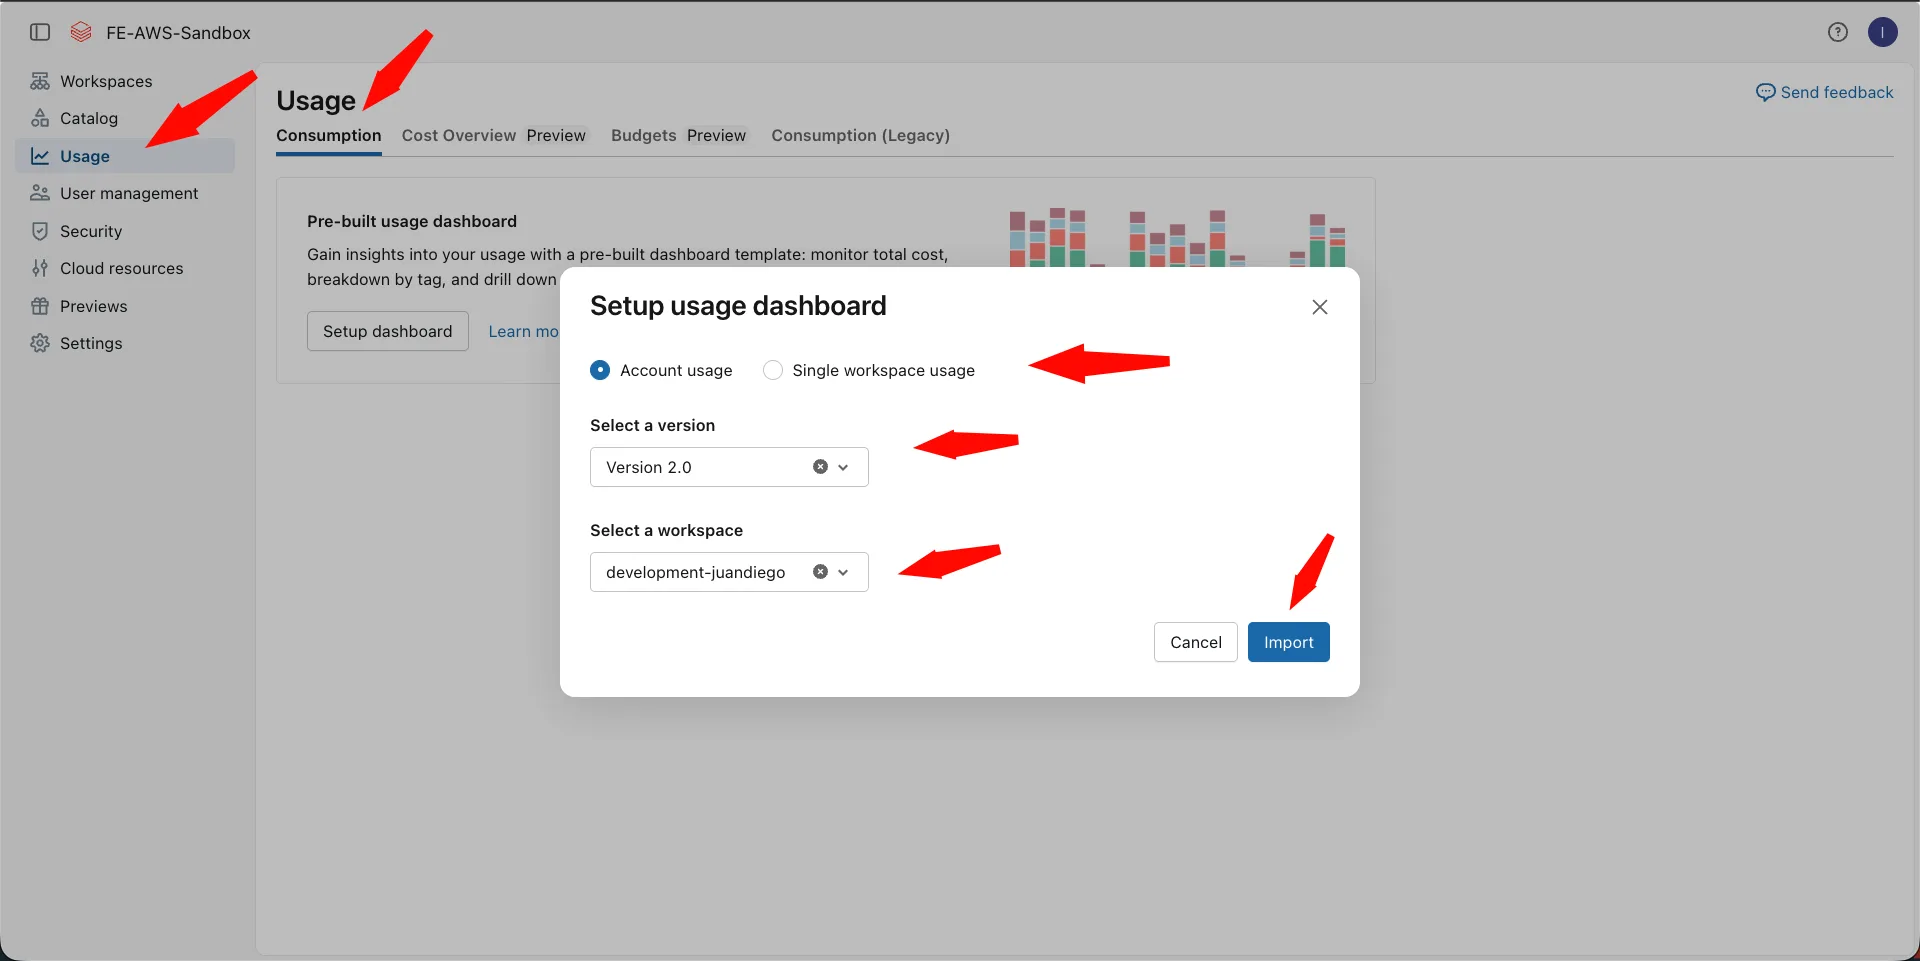
- Click Usage in the left sidebar.
- Click Setup dashboard.
- Choose the dashboard version. Usage Dashboard version 2.0 is in Public Preview; it adds cost forecasting and object-level drill-down. The standard version covers usage by product, SKU, tags, and top usage sources.
- Choose scope: entire account or single workspace.
- Pick the target workspace that should receive the dashboard.
- Click Import. You land on the new dashboard in that workspace.
3. Customize and publish (optional)
- Edit widgets, filters, and datasets like any AI/BI dashboard.
- Click Publish when stakeholders need a stable URL.
- Choose Viewer credentials (each viewer’s permissions apply) or Editor credentials (the editor’s permissions apply at refresh time).
4. Use the rest of the Usage page (graphs and downloads)
Still under Usage (same sidebar entry):
- Usage graph — Filter by workspace, SKU, or tag; toggle USD vs DBU; set the date range (UTC).
- Usage details — Tabular workspace breakdown aligned to the graph’s range.
- Pricing settings — Adjust per-SKU list rates so console estimates move closer to your contract. Invoices still include discounts and credits the UI does not model.
- Budgets — Account budgets live here too; follow Budget alerts and the official budgets guide.
- Download — Export aggregated or raw usage (CSV). Large exports may hit row caps; use
system.billing.usagefor full fidelity when you outgrow exports.
Some tenants split legacy visuals under Consumption (Legacy). If you only see Setup dashboard on Consumption, open Consumption (Legacy) (or equivalent) for the graph, details, pricing, and downloads.
Graphs and downloads reconcile to system.billing.usage. When numbers diverge from invoices, remember discounts and credits. See Usage dashboards.
5. Optional: build your own dashboard in AI/BI Dashboards
Add datasets from SQL on system.billing.usage and joined system.billing.list_prices. Start from Databricks AI/BI dashboards and Dashboards (AI/BI).
Verify
- Open the imported dashboard and confirm charts return data for a recent date range.
- Open the Custom tags view — untagged usage looks sparse until you tag compute (Tags and attribution).
- Ask a colleague with SELECT on
system.billing(and warehouse access if you published with viewer credentials) to open the published dashboard.
Troubleshoot
Dashboard tiles show permission denied
Grant SELECT on system.billing.usage and system.billing.list_prices, or republish with Editor credentials.
Imported dashboard only shows one workspace
You chose single-workspace scope. Re-import with entire-account scope or edit datasets.
No billing rows yet
Run a small job or notebook, then wait a few hours for usage rows to land.
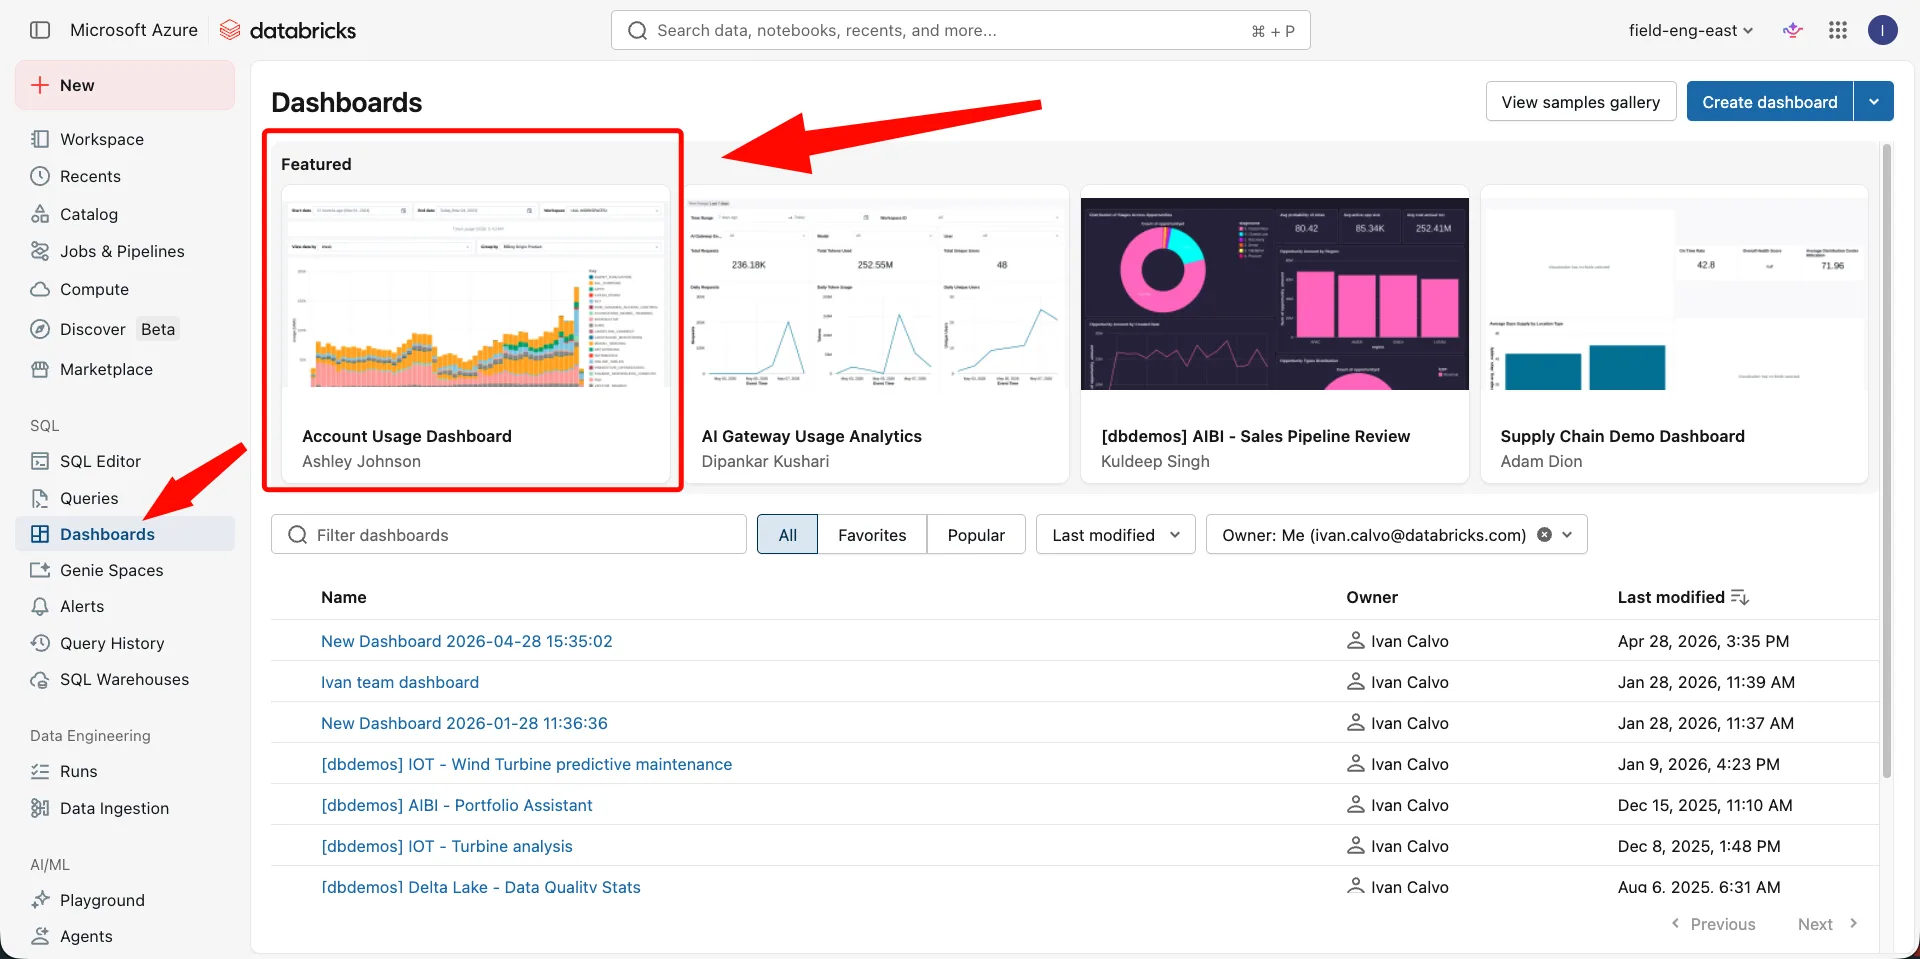
Cannot find the dashboard after import
Open the workspace you selected and search the workspace Dashboards list for Usage.
Next
- Do next: Additional dashboards
- Learn why: Account Console foundations
- Reference: Usage dashboards