Logging
Applies To: |
Framework Bundle Pipeline Bundle |
Configuration Scope: |
Global Pipeline |
Databricks Docs: |
NA |
The Lakeflow Framework provides logging capabilities to track pipeline execution and troubleshoot issues. By default, logging uses Python’s standard logging module with a plain text stdout handler (logger name lakeflowframework).
You can optionally plug in a custom logger via a dedicated logger.json config file.
Setting Precedence
Framework code and extensions should use the singleton accessor
pipeline_config.get_logger()rather than creating their own loggers.
Overview
Supported Loggers
The framework supports two logging modes. The active mode is determined by the logger.json configuration file; the standard logger is used when no custom logger is configured.
The framework supports the following loggers:
Standard Logger: Python’s standard
loggingmodule with a plain text stdout handler (logger namelakeflowframework).Custom Logger: A custom logger that can be configured via a
logger.jsonconfiguration file.
Log Levels
The framework supports standard Python logging levels:
DEBUG: Detailed information for debugging
INFO: General information about pipeline execution (default)
WARNING: Warning messages for potential issues
ERROR: Error messages for failed operations
CRITICAL: Critical errors that may cause pipeline failure
Spark logLevel Configuration
The default log level for all pipelines is INFO.
To specify a different log level, set the logLevel parameter in the Configuration section of a Spark Declarative Pipeline. Spark logLevel takes precedence over the level field in logger.json when the logger is resolved.
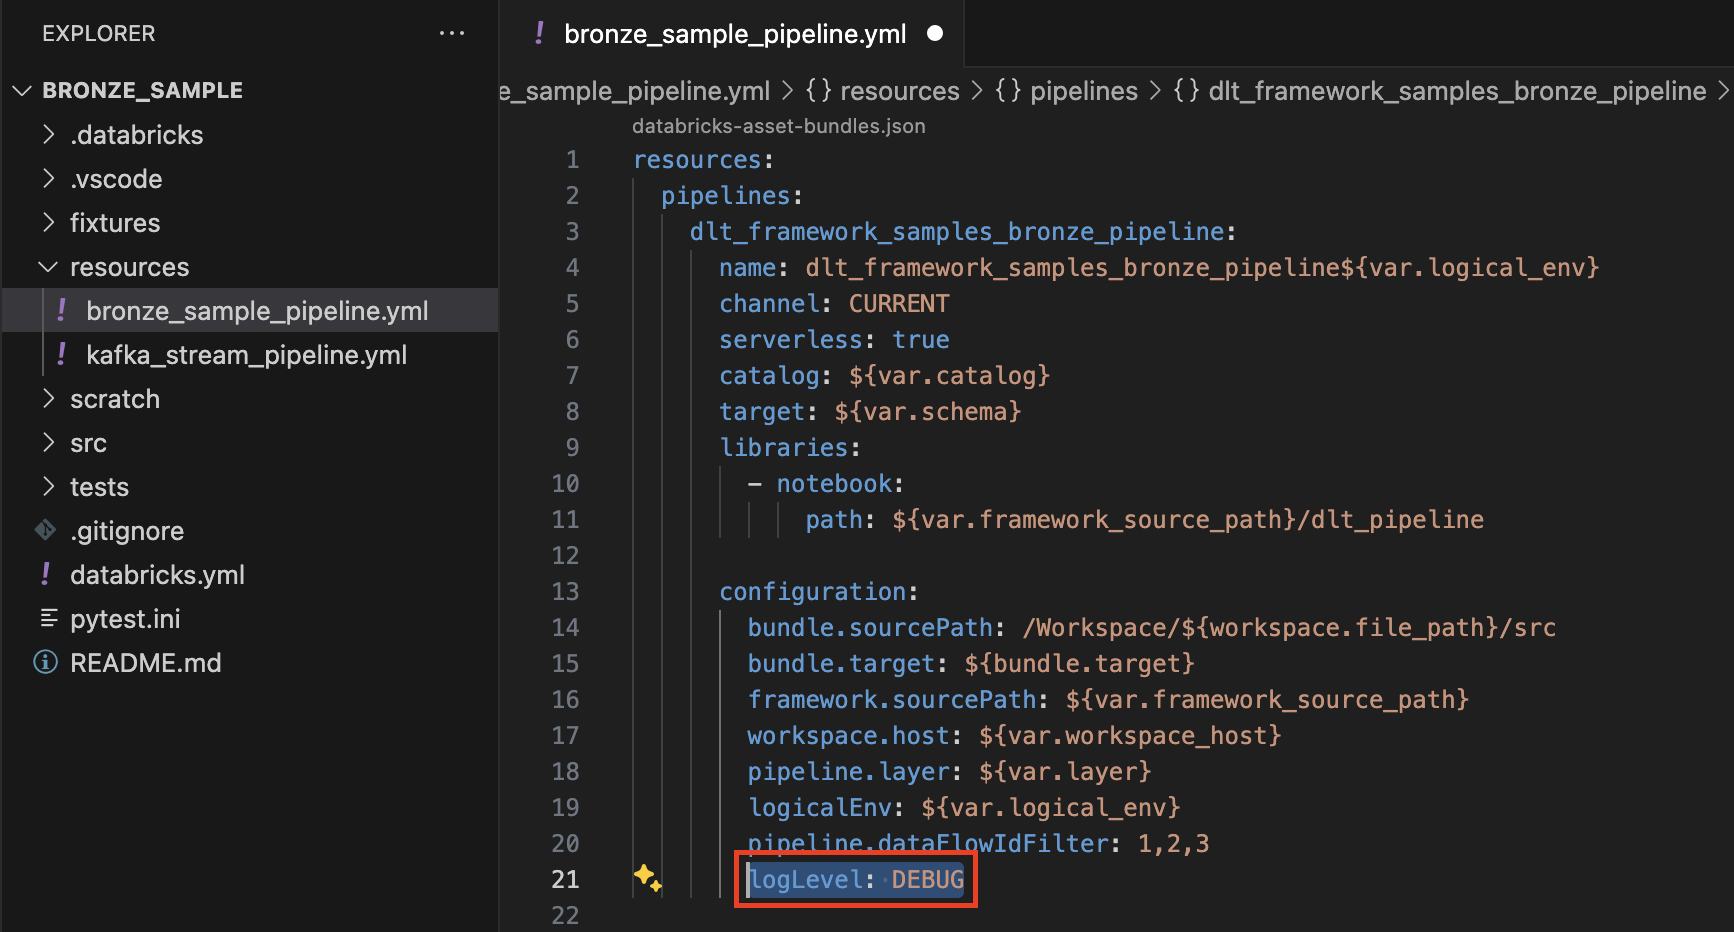
Setting the Log Level in the Pipeline YAML
Add logLevel in the configuration section of your pipeline resource YAML:
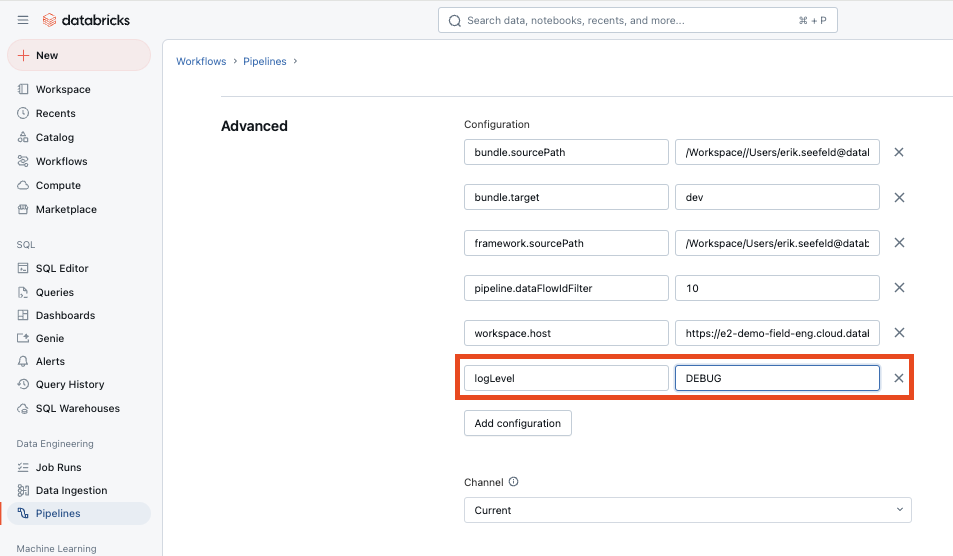
Setting the Log Level in the Databricks UI
Browse to your pipeline, open Settings, and add logLevel under Advanced Configuration:
Custom Logger Configuration
Custom logging is configured in logger.json files—not in global.json—so the framework can initialize logging before loading merged global configuration.
{framework_path}/src/local/config/logger.jsonNote
There is no config/default/logger.json shipped with the framework. The standard logger is always active unless you explicitly enable a custom logger by creating src/local/config/logger.json with enabled: true. The default values for all logger config fields are defined in code and documented in the schema below.
{bundle_path}/pipeline_configs/logger.jsonIf a file is missing, that side contributes an empty configuration and the standard logger remains active.
Configuration Schema
Field |
Default |
Framework / Pipeline |
Description |
|---|---|---|---|
|
|
✓ / ✓ |
When |
|
— |
✓ / ✓ |
Optional distribution name to probe (for example |
|
— |
✓ / ✓ |
Python module to import (for example |
|
— |
✓ / ✓ |
Callable on |
|
|
✓ / ✓ |
Keyword arguments passed to the factory after |
|
|
✓ / ✓ |
Minimum log level for the resolved logger. Overridden by the Spark |
|
|
✓ / ✓ |
When |
|
|
✓ only |
Framework-only control for merge precedence. Ignored if present in the bundle file. |
Merge Precedence (Framework + Bundle)
After mandatory Spark configuration provides framework.sourcePath and bundle.sourcePath, the framework loads both logger.json files and merges them:
allow_pipeline_logger_override: false (default)factory_args keys.allow_pipeline_logger_override: true (framework logger.json only)Keys present in only one file are retained. The pipeline bundle must not rely on defining allow_pipeline_logger_override; set it only in the framework file.
Custom Logger Contract
When implementing a custom logger for the framework, the following requirements
must be met to ensure compatibility with both the framework call sites and the
CompositeLogger mirror path.
Note
The step-by-step example below (structured_stdout_logger) is a fully
compliant reference implementation. Use it as a starting point or as a
working example of all requirements below.
# |
Requirement |
Detail |
|---|---|---|
1 |
Implement all six methods |
|
2 |
Handle |
The framework passes |
3 |
Discard |
These are Python |
4 |
Check level before formatting |
Apply your level filter before calling |
5 |
Accept |
The framework injects the resolved log level as a |
6 |
Accept and ignore |
The factory is called as |
7 |
Implement |
Called by |
class MyCustomLogger:
    """Minimal compliant custom logger skeleton."""

    def __init__(self, level: str = "INFO") -> None:
        import logging
        self._level = getattr(logging, level.upper(), logging.INFO)

    def _should_emit(self, level_name: str) -> bool:
        import logging
        return getattr(logging, level_name.upper(), logging.DEBUG) >= self._level

    def _strip_stdlib_kwargs(self, kwargs: dict):
        import traceback
        exc_info = kwargs.pop("exc_info", None)
        kwargs.pop("stacklevel", None)
        kwargs.pop("stack_info", None)
        if exc_info is True:
            return traceback.format_exc()
        return exc_info if isinstance(exc_info, str) else None

    def _emit(self, level: str, message: str, args: tuple, kwargs: dict) -> None:
        if not self._should_emit(level):
            return
        exc = self._strip_stdlib_kwargs(kwargs)
        formatted = message % args if args else message
        # ... write record ...

    def debug(self, message, *args, **kwargs): self._emit("DEBUG", message, args, kwargs)
    def info(self, message, *args, **kwargs): self._emit("INFO", message, args, kwargs)
    def warning(self, message, *args, **kwargs): self._emit("WARNING", message, args, kwargs)
    def error(self, message, *args, **kwargs): self._emit("ERROR", message, args, kwargs)
    def critical(self, message, *args, **kwargs): self._emit("CRITICAL", message, args, kwargs)
    def exception(self, message, *args, **kwargs):
        import traceback
        kwargs.pop("exc_info", None); kwargs.pop("stacklevel", None); kwargs.pop("stack_info", None)
        self._emit("ERROR", message, args, {**kwargs, "_exc": traceback.format_exc()})
    def close(self): pass


def get_logger(dbutils, spark, level="INFO", **factory_args):
    return MyCustomLogger(level=level)
Example — framework-level structured stdout logger (src/local/)
Note
This is an illustrative example using src/local/libraries/ — a
fork-safe location that makes the module available to all pipelines running
against this framework bundle without any per-pipeline configuration.
In practice, most teams will want to deliver their custom logger as a
Python package (wheel or PyPI) and install it on each pipeline cluster
via the standard cluster library mechanisms described in
Python Code, Libraries & Init Scripts. That approach decouples the logger from
the framework bundle and lets it be versioned and distributed independently.
Using src/local/libraries/ is best suited for lightweight, org-specific
customisations that you want to keep co-located with the framework bundle.
The following walkthrough sets up a structured JSON stdout logger at the
framework level using src/local/libraries/. Each log record is emitted as
a single-line JSON object, making it compatible with log aggregation tools
(Databricks log delivery, Splunk, Datadog) that parse structured JSON.
Step 1 — Create the logger module
Create src/local/libraries/structured_stdout_logger.py:
from __future__ import annotations

import json
import logging
import sys
import traceback
from datetime import datetime, timezone
from typing import Any


class StructuredStdoutLogger:
    """Emits each log record as a single-line JSON object to stdout."""

    def __init__(self, level: str = "INFO", logger_name: str = "lakeflowframework") -> None:
        self._level_value: int = getattr(logging, level.upper(), logging.INFO)
        self._logger_name: str = logger_name

    def _should_emit(self, level: str) -> bool:
        return getattr(logging, level.upper(), logging.DEBUG) >= self._level_value

    def _emit(self, level: str, message: str, exc_info: str | None = None, **kwargs: Any) -> None:
        if not self._should_emit(level):
            return
        record: dict[str, Any] = {
            "timestamp": datetime.now(timezone.utc).isoformat(),
            "level": level.upper(),
            "logger": self._logger_name,
            "message": message,
        }
        if kwargs:
            record["extra"] = kwargs
        if exc_info:
            record["exc_info"] = exc_info
        print(json.dumps(record, default=str), file=sys.stdout, flush=True)

    @staticmethod
    def _format(message: str, args: tuple) -> str:
        if args:
            try:
                return message % args
            except (TypeError, ValueError):
                return f"{message} {args}"
        return message

    def _extract_exc_info(self, kwargs: dict) -> str | None:
        """Pop and resolve logging.Logger-compatible control kwargs."""
        exc_info = kwargs.pop("exc_info", None)
        kwargs.pop("stacklevel", None)
        kwargs.pop("stack_info", None)
        if exc_info is True:
            return traceback.format_exc()
        if isinstance(exc_info, str):
            return exc_info
        return None

    def debug(self, message: str, *args: Any, **kwargs: Any) -> None:
        if not self._should_emit("DEBUG"):
            return
        exc = self._extract_exc_info(kwargs)
        self._emit("DEBUG", self._format(message, args), exc_info=exc, **kwargs)

    def info(self, message: str, *args: Any, **kwargs: Any) -> None:
        if not self._should_emit("INFO"):
            return
        exc = self._extract_exc_info(kwargs)
        self._emit("INFO", self._format(message, args), exc_info=exc, **kwargs)

    def warning(self, message: str, *args: Any, **kwargs: Any) -> None:
        if not self._should_emit("WARNING"):
            return
        exc = self._extract_exc_info(kwargs)
        self._emit("WARNING", self._format(message, args), exc_info=exc, **kwargs)

    def error(self, message: str, *args: Any, **kwargs: Any) -> None:
        if not self._should_emit("ERROR"):
            return
        exc = self._extract_exc_info(kwargs)
        self._emit("ERROR", self._format(message, args), exc_info=exc, **kwargs)

    def critical(self, message: str, *args: Any, **kwargs: Any) -> None:
        if not self._should_emit("CRITICAL"):
            return
        exc = self._extract_exc_info(kwargs)
        self._emit("CRITICAL", self._format(message, args), exc_info=exc, **kwargs)

    def exception(self, message: str, *args: Any, **kwargs: Any) -> None:
        kwargs.pop("exc_info", None)
        kwargs.pop("stacklevel", None)
        kwargs.pop("stack_info", None)
        self._emit("ERROR", self._format(message, args), exc_info=traceback.format_exc(), **kwargs)

    def close(self) -> None:
        pass


def get_logger(
    dbutils: Any,
    spark: Any,
    level: str = "INFO",
    logger_name: str = "lakeflowframework",
) -> StructuredStdoutLogger:
    """Factory called by the framework as factory(dbutils, spark, **factory_args)."""
    return StructuredStdoutLogger(level=level, logger_name=logger_name)
Step 2 — Enable the logger via src/local/config/logger.json
Add or update src/local/config/logger.json in the framework bundle
(a sparse file is sufficient — only the keys you want to set are needed):
{
  "enabled": true,
  "module": "structured_stdout_logger",
  "factory": "get_logger",
  "level": "INFO",
  "factory_args": {
    "logger_name": "lakeflowframework"
  }
}
Because the module lives in src/local/libraries/, it is on sys.path
automatically — no library (pip install) entry is needed.
Step 3 — Deploy and verify
Deploy the framework bundle and run a pipeline. Log output in the Databricks Logs UI should now appear as single-line JSON:
{"timestamp": "2026-05-17T00:20:00.123456+00:00", "level": "INFO", "logger": "lakeflowframework", "message": "Initializing Pipeline..."}
{"timestamp": "2026-05-17T00:20:01.456789+00:00", "level": "ERROR", "logger": "lakeflowframework", "message": "Failed to process Data Flow Spec: schema mismatch", "exc_info": "Traceback (most recent call last):\n  ..."}
Example — enable a third-party logger in the pipeline bundle
Install the library on the pipeline (wheel or PyPI via environment.dependencies
in the pipeline resource YAML), then add pipeline_configs/logger.json:
{
  "enabled": true,
  "library": "custom_logger",
  "module": "custom_logger.lakeflow_logger",
  "factory": "get_logger",
  "factory_args": {
    "log_to_output": false,
    "async_log_processing": false
  },
  "level": "INFO",
  "mirror_to_stdout": true
}
Tip
When mirror_to_stdout is true and your custom logger also writes to
stdout, set the appropriate factory arg (e.g. log_to_output: false) to
prevent duplicate lines in the Databricks pipeline Logs UI.
Resolution and Fallback
Logger resolution is implemented in src/logger.py and runs at the start of DLTPipelineBuilder initialization:
Load framework and bundle
logger.json.Merge per precedence rules.
If
enabledisfalse, return the framework default stdout logger.If
libraryis set but not importable, fall back to the default logger with a warning.Otherwise import
module, callfactory(dbutils, spark, **factory_args), and validate that the returned object exposesdebug,info,warning,error,critical, andexception.On any failure (import, factory, invalid return type, downstream init errors), fall back to the default logger with a warning—the pipeline does not fail because of logging misconfiguration.
If the custom logger succeeds and
mirror_to_stdoutistrue, wrap it in a CompositeLogger (custom primary + framework stdout mirror). Iffalse(default), the framework default stdout logger is silenced so it does not produce duplicate output.
Composite Logging
When a custom logger initializes successfully and mirror_to_stdout is true, the framework uses a single CompositeLogger instance registered in pipeline_config:
Log calls go to the custom logger first (primary), then to the framework default stdout logger (mirror).
Failures in the primary logger are logged on the mirror; the pipeline continues.
Failures in the mirror must not break the pipeline.
Set mirror_to_stdout to true only when your custom logger does not write to stdout and you still want pipeline log output visible in the Databricks Logs UI (for example, a custom logger that writes exclusively to an external system such as Application Insights or Datadog). If your custom logger already writes to stdout, leave mirror_to_stdout at its default of false.
Using the Logger in Code
from pipeline_config import get_logger

logger = get_logger()
logger.info("Processing batch %s", batch_id)
utility.set_logger remains for backward compatibility and delegates to the framework default logger factory; new code should use pipeline_config.get_logger().
Custom loggers that support async flushing may require an explicit close() at the end of the pipeline. Consider a post_init hook under extensions/post_init/ that calls close() on the primary logger when exposed.
Troubleshooting
Custom logger not loading / pipeline still uses default logger
The framework always falls back to the default stdout logger on any initialisation
error rather than failing the pipeline. Check the pipeline logs for a warning
beginning with Failed to initialize custom logger: — the message will contain
the original exception.
Common causes:
Module not on
sys.path— if the module lives insrc/local/libraries/it is registered automatically. If it is a cluster library, confirm the library is installed on the pipeline cluster and themodulepath matches the installed package’s import path.Wrong
factoryname — the value must match the exact function name exported by the module (case-sensitive).Missing
enabled: true— the default config hasenabled: false; the override config must explicitly set it totrue.Config not found —
logger.jsonmust live atsrc/local/config/logger.json(framework bundle) orpipeline_configs/logger.json(pipeline bundle). Confirm the file is present and valid JSON.
Logger ignores logLevel = "DEBUG" set in pipeline settings
The resolved log level is injected automatically into factory_args as
"level" before the factory is called. The factory must accept a
level keyword argument and forward it to the logger instance — see
requirement 5 in the Custom Logger Contract above.
If the third-party logger uses a different parameter name (e.g. log_level),
add a thin wrapper (see below) that maps the argument:
# src/local/libraries/my_logger_wrapper.py
from mylib import get_logger as _get_logger

def get_logger(dbutils, spark, level="INFO", **factory_args):
    return _get_logger(dbutils, spark, log_level=level, **factory_args)
Third-party logger cannot be called as factory(dbutils, spark, **factory_args)
Some loggers require multi-step initialisation, a context manager, or arguments
that are incompatible with the framework’s injection. Place a thin wrapper in
src/local/libraries/ (framework bundle) or as a cluster-installed module
(pipeline bundle). The wrapper’s get_logger handles the adaptation and
logger.json points to the wrapper rather than the upstream library:
# src/local/libraries/my_logger_wrapper.py
from my_logger.databricks import get_logger as _get_logger

def get_logger(dbutils, spark, level="INFO", **factory_args):
    """Thin adapter — translates framework call convention to my_logger."""
    return _get_logger(dbutils, spark, level=level, log_to_output=False, **factory_args)
{
  "enabled": true,
  "module": "my_logger_wrapper",
  "factory": "get_logger",
  "level": "INFO",
  "factory_args": {}
}
Viewing the default STDOUT Logs
View logs in the Databricks UI:
Open the desired pipeline.
Select the desired Update ID (pipeline execution).
On the right, open the Update tab and click Logs at the bottom.
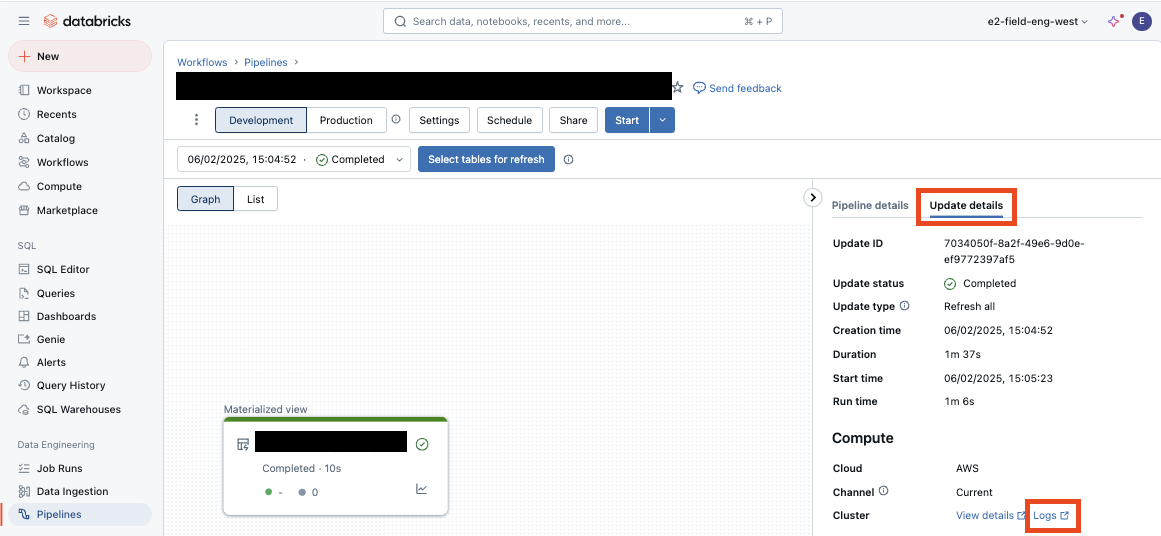
A new browser tab opens with output in the STDOUT section (including framework mirror output when
mirror_to_stdoutis enabled):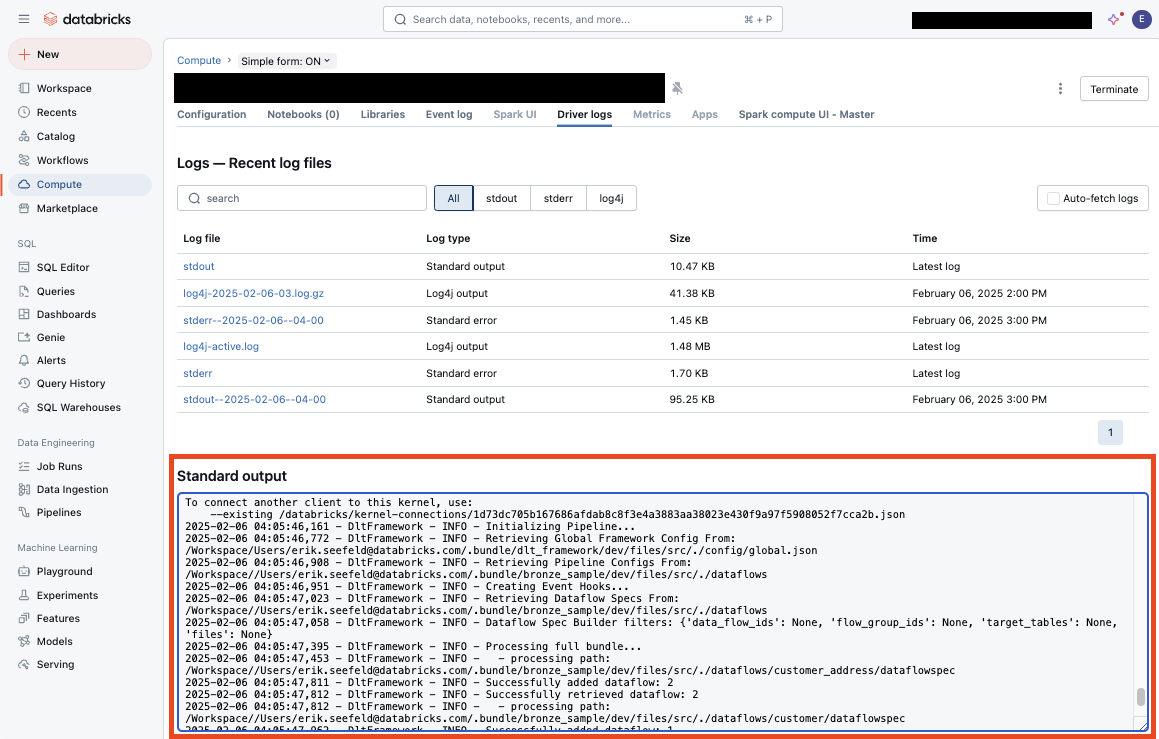
Permissions to View Logs
By default, only the pipeline owner has permission to view logs for a pipeline execution.
To grant other users access, add the following Spark configuration to the framework using the Spark Configuration feature:
"spark.databricks.acl.needAdminPermissionToViewLogs": "false"
This is documented in the Databricks documentation: https://docs.databricks.com/en/compute/clusters-manage.html
Example Log Messages
Default stdout logger output (plain text):
2025-02-06 04:05:46,161 - lakeflowframework - INFO - Initializing Pipeline...
2025-02-06 04:05:46,772 - lakeflowframework - INFO - Retrieving Global Framework Config From: {path}
2025-02-06 04:05:46,908 - lakeflowframework - INFO - Retrieving Pipeline Configs From: {path}
Flow creation:
2025-02-06 04:05:48,254 - lakeflowframework - INFO - Creating Flow: flow_name
2025-02-06 04:05:48,254 - lakeflowframework - INFO - Creating View: view_name, mode: stream, source type: delta
Error handling:
2025-02-06 04:06:26,527 - lakeflowframework - ERROR - Failed to process Data Flow Spec: {error_details}
Structured stdout logger output (JSON, via structured_stdout_logger):
{"timestamp": "2025-02-06T04:05:46.161000+00:00", "level": "INFO", "logger": "lakeflowframework", "message": "Initializing Pipeline..."}
{"timestamp": "2025-02-06T04:05:48.254000+00:00", "level": "INFO", "logger": "lakeflowframework", "message": "Creating Flow: flow_name"}
{"timestamp": "2025-02-06T04:06:26.527000+00:00", "level": "ERROR", "logger": "lakeflowframework", "message": "Failed to process Data Flow Spec: schema mismatch", "exc_info": "Traceback (most recent call last):\n  ..."}